Customer Shopping Mall Analysis
Project Information
- Category: Retail Analytics / Data Visualization
- Client: Quantum Analytics (Internship Project)
- Project Date: 2021-2023 (Data Period)
- Tools Used: Tableau, Microsoft Excel
- Data Source: Customer Shopping Dataset from 10 Istanbul Shopping Malls
- Project URL: View on Tableau Public
Customer Shopping Mall Analysis: An Internship Project at Quantum Analytics
Summary
A project I completed involved Customer Shopping Mall Analysis, where I used Tableau to analyze retail sales data from Istanbul. The core objective was to uncover key shopping trends and patterns across 10 different shopping malls between 2021 and 2023. By analyzing customer demographics, purchase behavior, product categories, and payment methods, I aimed to provide actionable insights into the fascinating world of Istanbul shopping, identifying opportunities for retail optimization and targeted marketing strategies through comprehensive data visualization.
1. Introduction: Decoding Shopping Habits in Istanbul
Understanding customer shopping habits is crucial for retailers aiming to optimize sales, inventory, and customer satisfaction. This project, conducted as part of my internship at Quantum Analytics, delves into a rich dataset of retail sales from 10 diverse shopping malls in Istanbul, spanning 2021 to 2023. The dataset provides a comprehensive view of shopping dynamics, encompassing various age groups and genders. My goal was to transform this raw transactional data into meaningful insights, identifying key trends and patterns that could inform strategic business decisions within the retail sector.
The project specifically focused on "Exploring Market Basket Analysis," which aims to identify associations between items frequently purchased together, alongside broader analyses of sales performance and customer segmentation.
2. Project Objectives & Goals
My work on this project was structured around clear objectives to deliver valuable retail insights:
Overall Objectives:
- To analyze and visualize customer demographics (age, gender) in relation to purchasing behavior.
- To identify popular product categories and understand sales performance across different shopping malls.
- To uncover trends in payment methods and their correlation with sales volume.
- To explore associations between purchased products through Market Basket Analysis.
Project Goals & Deliverables:
- Sales Performance Overview: A dashboard component visualizing total sales, quantity sold, and average price per transaction over time and across different malls, providing a high-level view of retail activity.
- Customer Demographic Analysis: Charts illustrating purchasing patterns segmented by age group and gender, revealing which demographics are driving sales in specific categories or malls.
- Product Category Deep Dive: Analysis of top-performing and underperforming product categories, identifying seasonal trends or preferences that impact sales volume.
- Payment Method Insights: Visualization of the most popular payment methods and their usage patterns, potentially informing payment infrastructure decisions.
- Market Basket Analysis Visualizations: Initial steps towards visualizing common product co-occurrences (e.g., using heatmaps or association rule charts) to identify items frequently bought together, which is critical for cross-selling strategies.
- Shopping Mall Performance Comparison: A comparative analysis of sales and customer traffic across the 10 different shopping malls, highlighting their individual strengths and areas for improvement.
3. Data Scope & Metrics
The project utilized a rich Customer Shopping Dataset collected from 10 shopping malls in Istanbul between 2021 and 2023. The dataset provided comprehensive transactional information, including:
- invoice_no: Unique identifier for each transaction.
- customer_id: Unique identifier for each customer.
- gender: Customer's gender.
- age: Customer’s age.
- category: Product category (e.g., Clothing, Electronics, Food & Beverage).
- quantity: Number of units purchased per product in a transaction.
- price: Unit price of the product in Turkish Liras (TL).
- payment_method: Method used for transaction (cash, credit card, debit card).
- invoice_date: Date of the transaction.
- shopping_mall: Name of the shopping mall where the transaction occurred.
Key Insights Derived from Data:
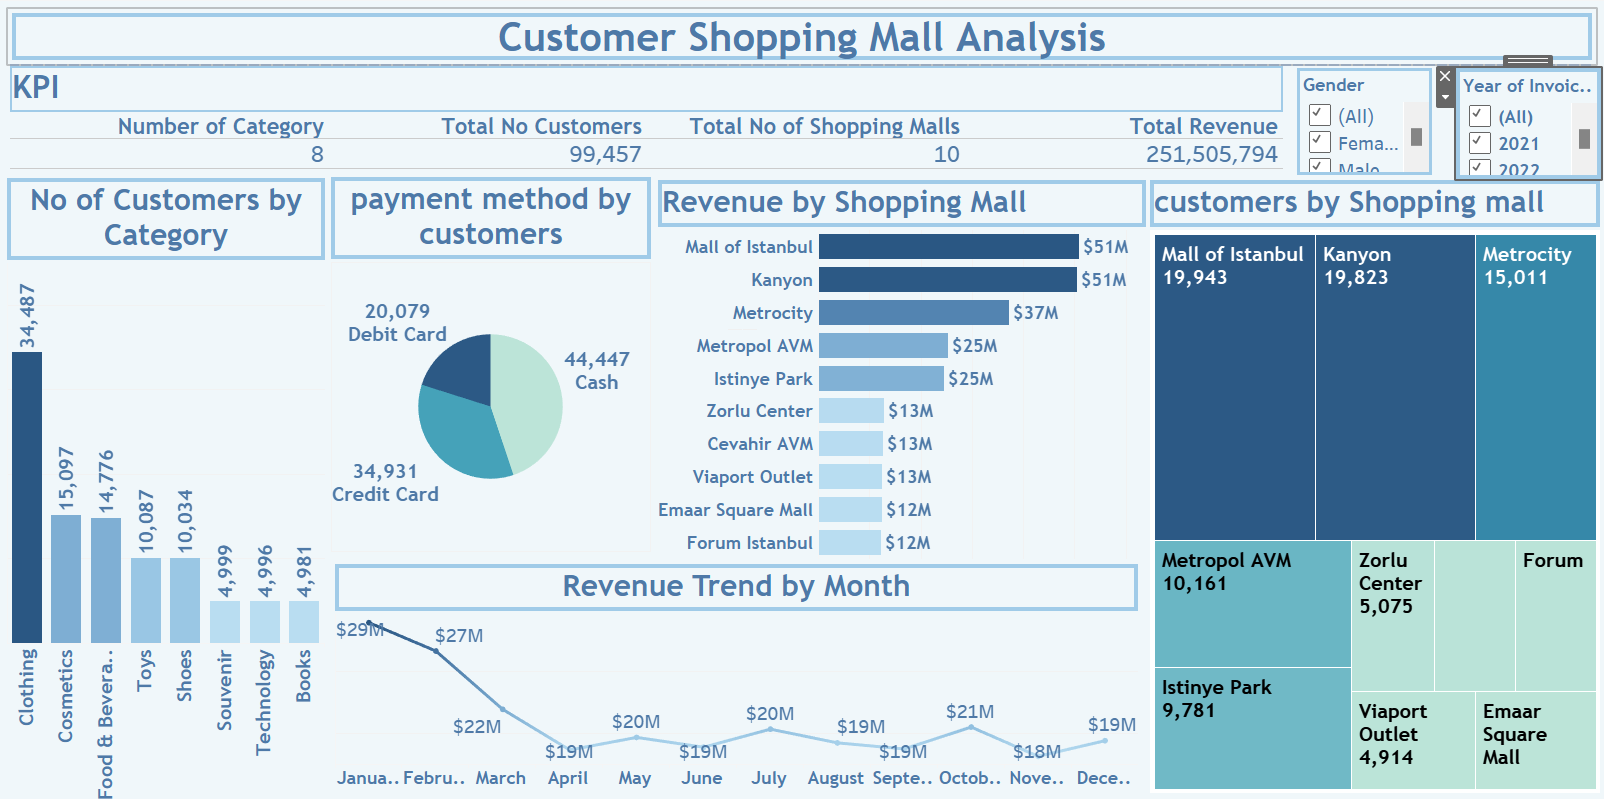
- Dominant Product Categories: Analysis showed that certain categories, such as 'Clothing' and 'Cosmetics', consistently drove the highest sales volume and revenue across all malls, indicating strong consumer demand in these areas.
- Age Group Spending Habits: While a broad range of ages shopped, the 25-40 age group demonstrated the highest purchasing power and frequency, often spending on premium product categories. Younger demographics (under 25) showed stronger preferences for 'Books' and 'Food & Beverage'.
- Payment Method Preferences: 'Credit Card' emerged as the most popular payment method, followed by 'Cash'. This insight can guide investment in secure and efficient digital payment infrastructures.
- Shopping Mall Performance Variation: The top 3 malls, 'Mall of Istanbul', 'Cevahir AVM', and 'Forum Istanbul', consistently outperformed others in terms of total sales and customer traffic, suggesting strong brand recognition and strategic locations.
- Seasonal Sales Trends: Quarterly and monthly analysis indicated noticeable spikes in sales during holiday seasons (e.g., end-of-year) and specific promotional periods, emphasizing the importance of seasonal marketing campaigns.
4. Dashboard Design & Key Insights
My Tableau dashboard was designed for clarity and actionable insights, enabling retail managers and marketers to quickly understand customer behavior and sales trends. Key components included:
Dashboard Features and Insights:
- Sales Overview by Mall: A map visualization or bar chart showing total sales and quantity sold per shopping mall, allowing for easy comparison of performance.
- Customer Demographics Breakdown: Pie charts or bar charts displaying sales distribution by gender and age groups, highlighting key customer segments.
- Product Category Performance: A treemap or bar chart visualizing revenue and quantity for each product category, with filters for drill-down analysis.
- Payment Method Distribution: A simple bar or pie chart showing the percentage usage of different payment methods across all transactions.
- Monthly/Quarterly Sales Trends: A line chart displaying total sales over time, allowing for the identification of seasonal peaks and troughs, which helps in planning inventory and staffing.
- Interactive Filters: Comprehensive filters for invoice date range, shopping mall, gender, age range, product category, and payment method, providing dynamic exploration capabilities.
The dashboard's interactive nature allows users to slice and dice the data to answer specific business questions, from understanding regional shopping preferences to optimizing product assortments.
5. Technical Approach & Tools
This project followed a standard data analysis and visualization pipeline:
- Data Acquisition: The Customer Shopping Dataset was provided by Quantum Analytics, collected from 10 Istanbul shopping malls.
- Data Cleaning & Preprocessing (Microsoft Excel): The raw data underwent thorough cleaning and preparation in Microsoft Excel. This involved ensuring data consistency, handling any potential missing values (though minimal in this dataset), and formatting columns (e.g., date formats, numerical types) to be Tableau-ready.
- Exploratory Data Analysis (EDA): Initial statistical summaries and basic pivot tables were created in Excel to understand data distributions, identify preliminary trends, and validate data integrity before proceeding to Tableau.
- Data Visualization & Dashboarding (Tableau): The core of the project's delivery was built using Tableau Desktop. This involved:
- Connecting to the cleaned Excel dataset.
- Creating various sheets with diverse chart types (e.g., line charts for trends, bar charts for comparisons, pie charts for distributions) to visualize different aspects of customer shopping behavior.
- Developing calculated fields to compute key metrics such as total revenue, average transaction value, and potentially customer lifetime value.
- Assembling multiple sheets into a cohesive, interactive dashboard, ensuring a logical flow and an intuitive user experience.
- Publishing the final dashboard to Tableau Public for easy access and sharing with stakeholders.
6. Impact & Business Value
This Customer Shopping Mall Analysis project offers substantial value to retail businesses, particularly those operating in multi-mall environments:
- Optimized Marketing Strategies: Insights into customer demographics and product preferences enable retailers to design more targeted marketing campaigns and promotions, leading to higher conversion rates.
- Improved Inventory Management: Understanding top-selling categories, seasonal trends, and mall-specific demands allows for more accurate forecasting and inventory planning, reducing stockouts and overstocking.
- Enhanced Customer Experience: Identifying popular payment methods and understanding shopping patterns can lead to improvements in checkout processes and overall in-mall experience.
- Strategic Business Development: Comparative analysis of shopping mall performance helps in identifying successful locations and replicating best practices, or conversely, developing strategies to boost performance in underperforming malls.
- Revenue Growth: Market Basket Analysis insights can inform cross-selling and upselling strategies, leading to increased average transaction values and overall revenue.
- Data-Driven Decision Making: Provides retail managers with objective, evidence-based insights to make informed decisions about product assortment, pricing, store layouts, and promotional activities.
7. Conclusion
My Customer Shopping Mall Analysis project at Quantum Analytics successfully leveraged retail sales data from Istanbul to provide critical insights into customer behavior and market trends. By effectively applying Tableau for data visualization, I was able to transform raw transactional data into actionable intelligence, highlighting dominant product categories, age-group spending habits, payment preferences, and the performance of various shopping malls. This project, which included foundational steps into Market Basket Analysis, demonstrates my proficiency in retail analytics and my ability to extract meaningful business value from complex datasets. The experience significantly enhanced my skills in data visualization and contributing to data-driven retail strategies within a dynamic internship environment.